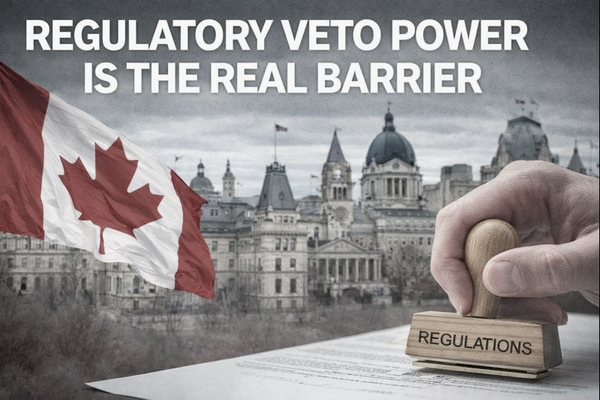
Why 2035 ZEV targets may outpace delivered charging access
Unmasking the $2.9B EV Standard: A deep dive into taxpayer-funded incentives vs. rigid sales mandates. We calculate the exact tax hit per income bracket and map the charging rollout against federal targets, revealing the reality of the 20% fast-charging constraint.

THE FACTS
Canada’s Electric Vehicle Availability Standard sets regulated sales targets for zero-emission light-duty vehicles beginning with the 2026 model year, rising through 2030 and reaching 100% by 2035. The policy applies to manufacturers and importers and is administered through federal regulation under Environment and Climate Change Canada. The targets are published as annual percentages tied to model years.
Budget 2022 proposed $1.7 billion to continue the Incentives for Zero-Emission Vehicles (iZEV) program until March 2025, subject to funding availability and eligibility rules. The iZEV program provides point-of-sale purchase or lease incentives for eligible light-duty vehicles, with program parameters administered by Transport Canada. The funding commitment is federal spending, not a regulatory compliance credit.
The Commissioner of the Environment and Sustainable Development reported on the Zero Emission Vehicle Infrastructure Program and related federal charging initiatives. The audit described a federal target of 50,000 charging ports and hydrogen refuelling stations and referenced alignment work between Natural Resources Canada and the Canada Infrastructure Bank. The departmental action plan states that public fast charging represents 20% of supported projects and that the Canada Infrastructure Bank had announced funding for 2,000 public fast chargers at the time of reporting.
TAXPAYER COST
| Income Category | Share of Tax | Cost Per Person |
|---|---|---|
| Top 10% | 54% | $501.92 |
| Middle 40% | 41% | $95.27 |
| Bottom 50% | 5% | $9.29 |
THE SPIN
Sources: CBC News, Toronto Star, The Tyee, National Post, The Hub, Financial Post, Canadian Auto Dealer, Electric Autonomy
The Left: Supply and affordability frame
Coverage centers on consumer access and model availability, treating the standard as a tool that shifts manufacturer behaviour toward the Canadian market. Incentives are framed as a bridge to lower operating costs and lower total ownership costs once supply normalizes. Public charging is positioned as a network effect problem where early coverage shapes later adoption. Delays are described as reducing policy certainty for investment decisions and leaving households in a wait state. Tariffs and industrial policy are treated as linked constraints on price and selection.
The Right: Feasibility and compliance-cost frame
Coverage centers on sales targets as a compliance burden tied to credit markets, dealer inventories, and the production mix of North American platforms. Incentives are framed as spending that does not solve supply, price, or grid constraints at the required timeline. Charging infrastructure is treated as a throughput problem where permitting, utility interconnection, and reliability determine adoption rates. Delays are described as a recognition of market share limits and trade exposure, with emphasis on short-run liquidity and competitiveness. The standard is framed as risking higher costs for households through constrained choice and higher vehicle prices.
THE WORLD VIEW
The United States of America
Sources: Reuters, Politico, Associated Press, The Verge
U.S. coverage frames Canada’s standard through the lens of supply chains, cross-border production, and policy alignment risk. The focus lands on whether Canada becomes an outlier market that forces North American platforms to allocate inventory and compliance credits differently. Tariffs and rule changes are treated as constraints shaping automaker capital allocation. Canada’s role is interpreted as leverage in broader trade negotiations rather than a self-contained climate policy. Reliability of charging and availability of lower-priced models are treated as prerequisites for any regulatory tightening.
The Global View
Sources: The Guardian, Financial Times, Bloomberg, The Economist
Global coverage frames the issue as a test case in managing electrification under mixed signals on industrial policy, affordability, and grid decarbonization. The standard is treated as one instrument inside a wider transition portfolio where policy credibility determines private capital timing. Canada is interpreted as a mid-sized market competing for constrained global EV supply while also attempting domestic manufacturing scale-up. Charging networks are treated as public-private coordination problems with uneven regional outcomes. Long-run implications are framed as competitiveness, energy system planning, and credibility of net-zero trajectories.
WHAT THIS MEANS
Will this raise my household costs this year?
Not directly.
Most federal costs are already committed through existing programs and audits. The near-term household impact shows up through vehicle pricing and incentive availability, not a new tax line. The binding constraint is charger reliability and access, which shapes whether an EV replaces a household vehicle.
Are younger Canadians locked into higher transition costs than Boomers?
Yes.
The 2030–2035 targets align with when younger cohorts are forming long-term vehicle habits. If public fast charging remains a minority share of supported builds, adoption concentrates where private home charging is possible. That shifts convenience and resale risk toward renters and multi-unit residents.
Will this change service delivery in the auto sector and charging market?
Yes.
Dealers and fleets plan inventory, training, and servicing around policy timelines and charging access. A system where public fast charging is a smaller share pushes demand toward workplace, fleet, and private installations. That changes where capital flows and which customers are practically served.
Does this play out differently in the West, Ontario/Quebec, and the Maritimes?
Yes.
Provinces with higher density corridors and more multi-unit housing face higher dependence on public fast charging. Regions with longer driving distances rely more on corridor fast charging to make adoption functional. The constraint is not incentive design; it is where chargers are placed and how consistently they work.
Does this affect Canada’s national interest with allies and trade partners?
This reflects a trade-off.
Regulated targets signal direction to investors and partners, but compliance timelines interact with North American platform decisions. If Canada cannot match charging access with targets, it becomes a smaller market with higher allocation risk. The credibility test becomes whether delivered infrastructure matches the regulated pathway.
THE SILENT STORY
FAST CHARGING IS THE BOTTLENECK, NOT TARGETS
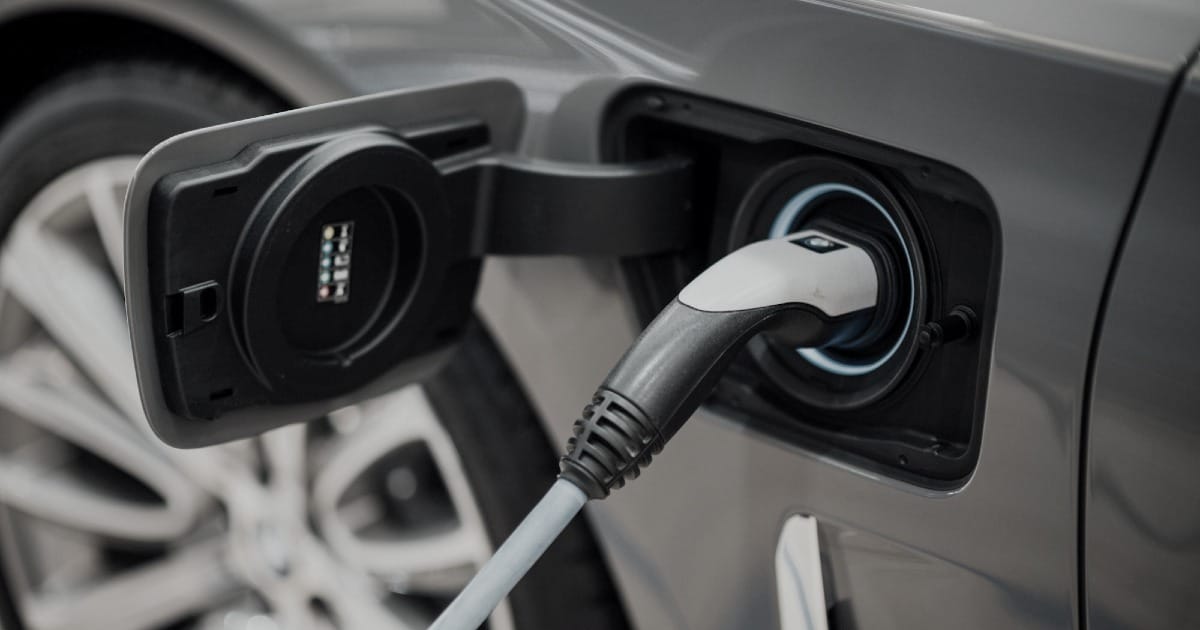
Public debate clusters around percentages: 20% by 2026, 60% by 2030, 100% by 2035. The limiting factor is not the percentage table. The limiting factor is the public fast-charging system that makes adoption usable for drivers without home charging.
Fast charging is the bridge between policy and behaviour because it substitutes for private home charging. It is a corridor system, not a neighbourhood amenity, and its value depends on uptime, location, and interoperability. That means the effective capacity is not the number of ports funded; it is the number that work when needed.
Training timelines and specialization sit inside the delivery chain. Utility interconnection work requires planning, engineering, and scheduling that does not compress to procurement timelines. Site hosts need electrical design, permitting, and construction sequencing. Operations requires monitoring, repair, parts logistics, and service-level standards.
Money can increase the number of applications and the size of awards. Money does not shorten interconnection queues, transformer availability, or commissioning steps. Money does not remove the need for standard performance measurement, reliability tracking, and enforcement of uptime expectations.
The incentive blind spot is political time. Targets and rebate announcements fit budget cycles and headline cadence. Charging uptime, interconnection lead times, and service quality are operational systems that move on slower clocks and publish fewer visible milestones.
"You can print targets, but you cannot print working plugs."
If the constraint persists, regulated targets and spending can coexist with low functional access. The risk is capability on paper without the operational system that makes it real. The outcome becomes compliance debate while adoption remains determined by where charging works.
SOURCE LEDGER
- Environment and Climate Change Canada — Canada’s Electric Vehicle Availability Standard: regulated targets for zero-emission vehicles (2023)
- Natural Resources Canada —Zero-Emission Vehicle Infrastructure Program (ZEVIP) (2024).
- Parliamentary Budget Officer —Costing of the Zero-Emission Vehicle Mandate (2024)
- Statistics Canada —New motor vehicle registrations, quarterly (2025)
- Natural Resources Canada —Zero-Emission Vehicle Infrastructure Needs Assessment (2022/23)